
The Aero Testing Process p.2
Introduction
One of the conclusions to Part 1 of this blog was that outdoor aero testing was challenging due to the unpredictable nature of the weather. To minimise the noise from environmental factors, we headed into an indoor velodrome for our next batch of testing. This blog continues our deep dive into the process of aero testing through our engineering internship program and looks to answer the question; What benefits are there to aero testing on an indoor velodrome?
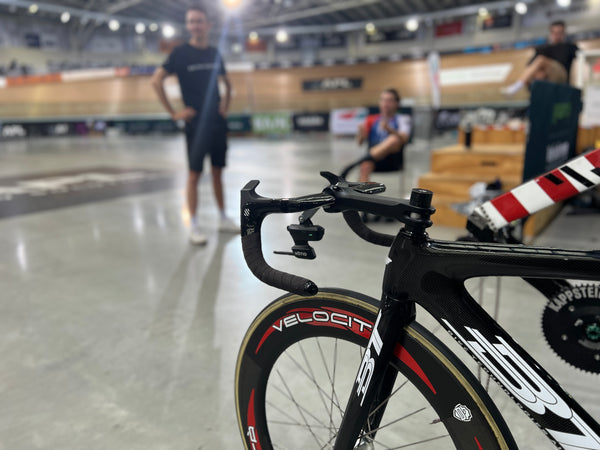
BT ultra with the Notio Aerometer attached prior to aero testing
What did we test?
Continuing the theme of handlebar testing from Part 1, we focused on the following two case studies:
- Testing the different widths of the Skat endurance handlebar in the hood Grip C position.
- On a separate day, testing the Altias handlebar compared to the Track Sprint handlebar
When comparing the Altias and Track Sprint handlebars it was important to have them positioned in the same x and y coordinates relative to the bottom bracket (diagram below). This way we know any aero differences are due to the handlebar rather than the bike fit. For this situation, the Altias handlebar had 42mm less drop than the Track Sprint handlebar. To account for this, we set the Altias bars up with a -6° stem angle (compared to +6°) and a 10mm shorter stem length.
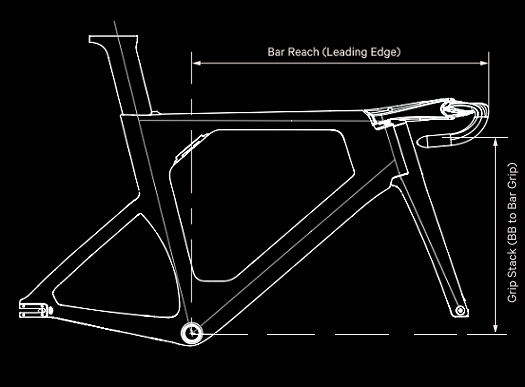
Diagram showing stack and reach to the handlebar contact point.
Why test these variables?
Knowing what is faster or slower is helpful, but quantifying these differences will help the athlete make informed decisions about their equipment. All the while, we can collect valuable insights into the data capturing process for marketing and R&D purposes.
Testing handlebar width is a debated topic. It’s now widely accepted that narrower is faster, but is there a limit? Testing the different Skat Endurance Handlebar widths when ridden in the hoods will help identify this for the athlete. Similarly, comparing the Altias and Track Sprint Handlebars directly against one another is a validation method for justifying how much of a benefit there is to the handlebar selection in the sprint bar context.
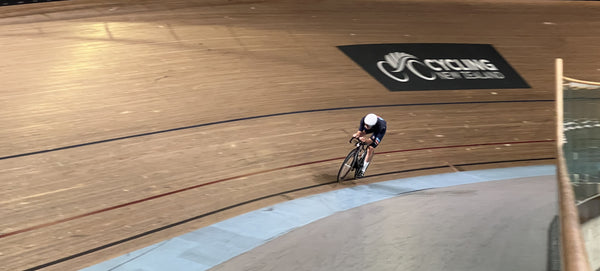
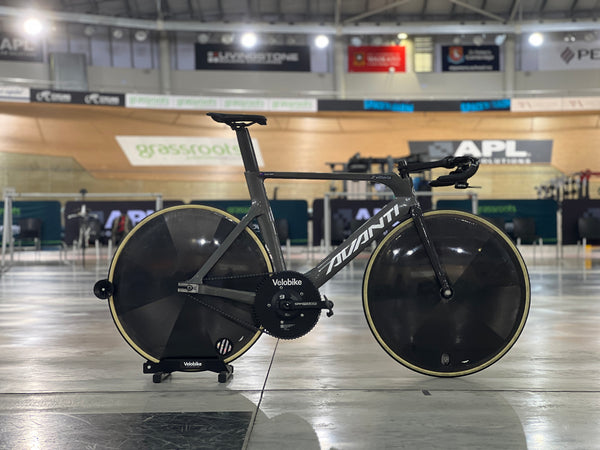 Avanti Rio Sprint set up for aero testing
How did the process differ from outdoor testing?
Velodromes are usually private facilities and are run as a business. Time is money and working around a booking schedule is critical. Making sure the aero test is worthwhile and realistic within the time frame is important. And if doing multiple repeat tests, choosing similar times of the day can help mitigate environmental changes such as temperature or air density.
Using an outdoor track on the other hand is a less controlled testing environment but is generally more accessible. They are usually public facilities and have less structured training and racing booked. This makes it a cheaper and more available resource.
The indoor setting allowed us to concentrate exclusively on the variables we aimed to measure, free from weather disruptions. This more controlled environment produced cleaner data which enabled us to run shorter test distances. We carried out 1km test runs compared to the 2 km outdoor test runs. The graphs below show wind speed data from indoor and outdoor test runs. Note the scale of the graphs.
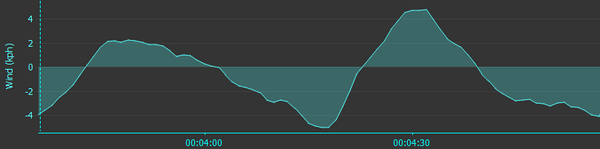
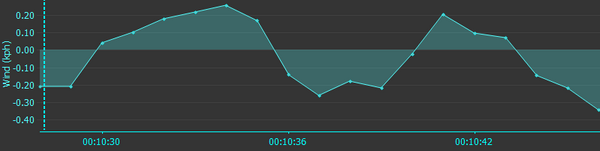
Wind speed is accounted for in the CdA calculation, however these bigger changes in wind speed make it challenging for the athlete to hold consistent speed and power over the test run. This external variable disturbs the results because energy losses due to acceleration can be unaccounted for in the software when taking averages over a test run. Being indoors therefore improved the reliability of the results and also streamlined the process due to the shorter test runs.
Indoor velodrome testing came with challenges due to the busier environment. The track needed to be booked out, to ensure a safe environment and to prevent the aerodynamic wake from other rider’s affecting the wind speed measurements. The increased density of ANT+ signals also emphasised the importance of knowing the sensor IDs prior to arriving at the track.
Results
Below are some of the results from the aero tests. They are specific to the athlete and conditions during the test so cannot be assumed to hold true in all scenarios.
-
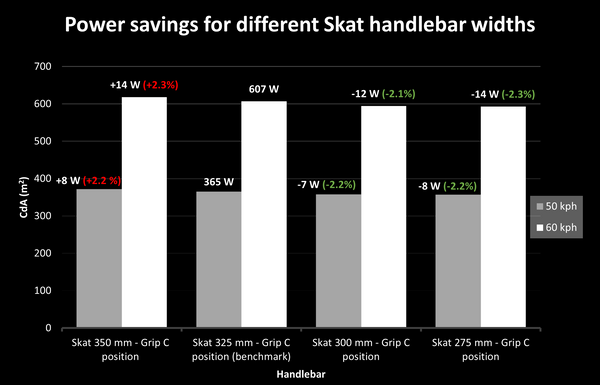
For the athlete testing Skat handlebar widths, the narrower handlebars tested faster. In the graph below you can see that the difference between the two narrowest widths was small, suggesting the athlete had reached the limit of aero gains due to handlebar widths because of either their body type or bike fit. An example of this would be the effect of not having enough reach. This can cause the rider’s elbows to splay outwards to avoid hitting their knees, hence undoing the aero benefit because the position is not best optimised for the handlebars.
-
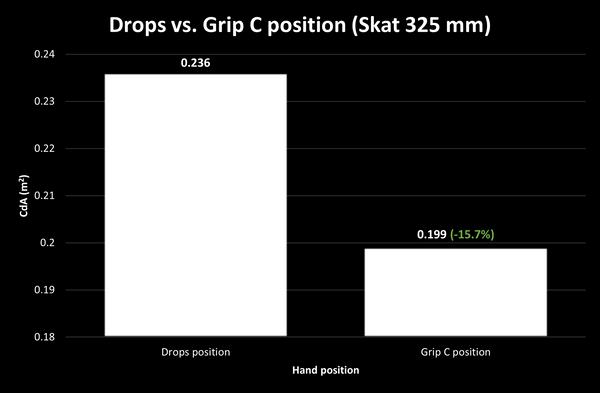
With this athlete we also tested two different hand positions on the Skat 325 mm handlebar. The Grip C position compared to the drops had a 15.7% CdA reduction, equating to 60 watts at 50 kph and 102 watts at 60 kph. It enabled the athlete to adopt a horizontal forearm, tucked head and flatter back, which explains why the position was so effective for reducing CdA.
- For the athlete testing the Altias and Track Sprint handlebars, we recorded a 3.5% CdA reduction for the Altias handlebars. The following graph shows the estimated power needed to achieve certain speeds using the two CdA values.
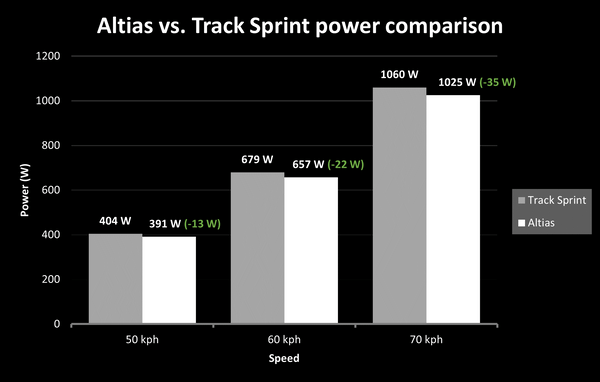
The improvement could be explained by many of the optimised features on the Altias handlebars, but the largest contributor would be how the shape of the handlebars enables a lower-torso, bent arm, aero tuck position. This was the result we expected however we had less confidence in the values, which is unpacked in the following discussion.
Discussion
For the case study into Skat handlebar widths, the indoor testing session produced clean data. The benchmark tests gave consistent values and there was minimal noise seen in the graphs. Apart from one outlier, all 10 test runs were within 1.5% from the estimated CdA we had calculated in our CdA tool. This was a useful validation method.
Finding out that the narrowest handlebars tested very similar to the second narrowest was a surprise result. Because of the trust we had in these data sets the athlete was able to make an informed decision: it was better to use the second narrowest width because you get all the aero benefit but with more comfort than the narrowest.
The feedback we received from this athlete was that the results were useful. “It [the result] gives me a great baseline CdA to work from. The results are beneficial in my understanding of the gains that a pair of handlebars can make”. We also picked up some valuable insights from the athlete. To maintain consistency between test runs they were dropping down the track to get up to speed before the test run in the same place each time. They were also making sure the helmet visor was 2 fingers width away from their nose to ensure it was positioned the same for each test.
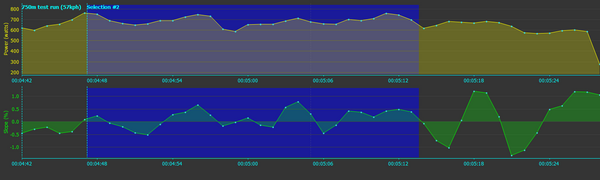
When testing the Altias handlebars with a sprint athlete, we struggled to achieve the same quality of data. The acceleration graph was choppy, and the slope percentage had more movement - indicating the rider was deviating off their line. Track sprinting is a faster, more explosive discipline which explains the messier data.
Because of this, we cropped the intervals to find sections of the test runs that were executed smoothly. The difference in CdA values was significant (up to two hundredths between the uncropped and cropped interval). The graph below shows the cropped interval (blue section) which excludes the slope (green) noise at the end of the interval and the power (yellow) drop off at either end of the interval.
After cropping an interval you have a CdA value that has been averaged over a smaller time period. The implications of this are that the result becomes more influenced by slight inconsistencies and hence less accurate. To be more confident in results with track sprinters, you could run more repeat tests. However, sprinters train for short races so the best method could be to run an aero testing session over multiple days to collect enough data that is not affected by fatigue.
As you can see, despite the environment being more controlled, indoor velodrome aero testing still poses challenges. There are many aspects of the testing process that need to be meticulously monitored to ensure the CdA values are accurate and usable. Because of the limited accessibility of indoor velodromes and fragile nature of the results, outdoor testing is the best place to start aero testing. Once the process is refined and benchmark tests are producing consistent values on different sessions, you can have more confidence to move to an indoor velodrome to capture accurate CdA values. Having expertise and someone experienced in aero testing is always recommended when starting your aero testing journey.
Written by Dan Gardner as part of an Engineering internship with Velobike Innovation